In 1978, a young researcher named Pierre Coullet (born in 1949) from the University of Nice and Charles Tresser (born in 1950), a graduate student, got interested in the mechanisms leading from laminar to turbulent fluids. Such questions are notoriously hard and they decided to start with very simple mathematical models based on iterating a map of the unit interval into itself. As for Hénon’s model, numerical experiments were decisive. The novelty they bring, which seems obvious nowadays, is to develop an interactive approach in their experiments ; parameters are changed repeatedly in a simple way to explore almost in real-time the behavior of the models. So, they studied a class of “unimodal” maps (their graph has a single “bump”), the simplest one being the logistic map : The value $x_{n+1}$ at time $n+1$ is obtained from $x_n$, the value at time $n$, by the formula $x_{n+1}=rx_n(1-x_n)$, where the control parameter $r$ satisfies $0 < r \leq 4$, and $0 \leq x_n \leq 1$ for all $n \geq 0$.
The same year, independently of Coullet and Tresser, Mitchell Feigenbaum (1944- 2019), researcher at the Los Alamos Scientific Laboratory, also studied the behavior of this kind of maps, in the wake of an article by N. Metropolis, M. L. Stein, and P. R. Stein [1], which was itself in the wake of the article by P. R. Stein and S. Ulam [42] mentioned in Section 1.
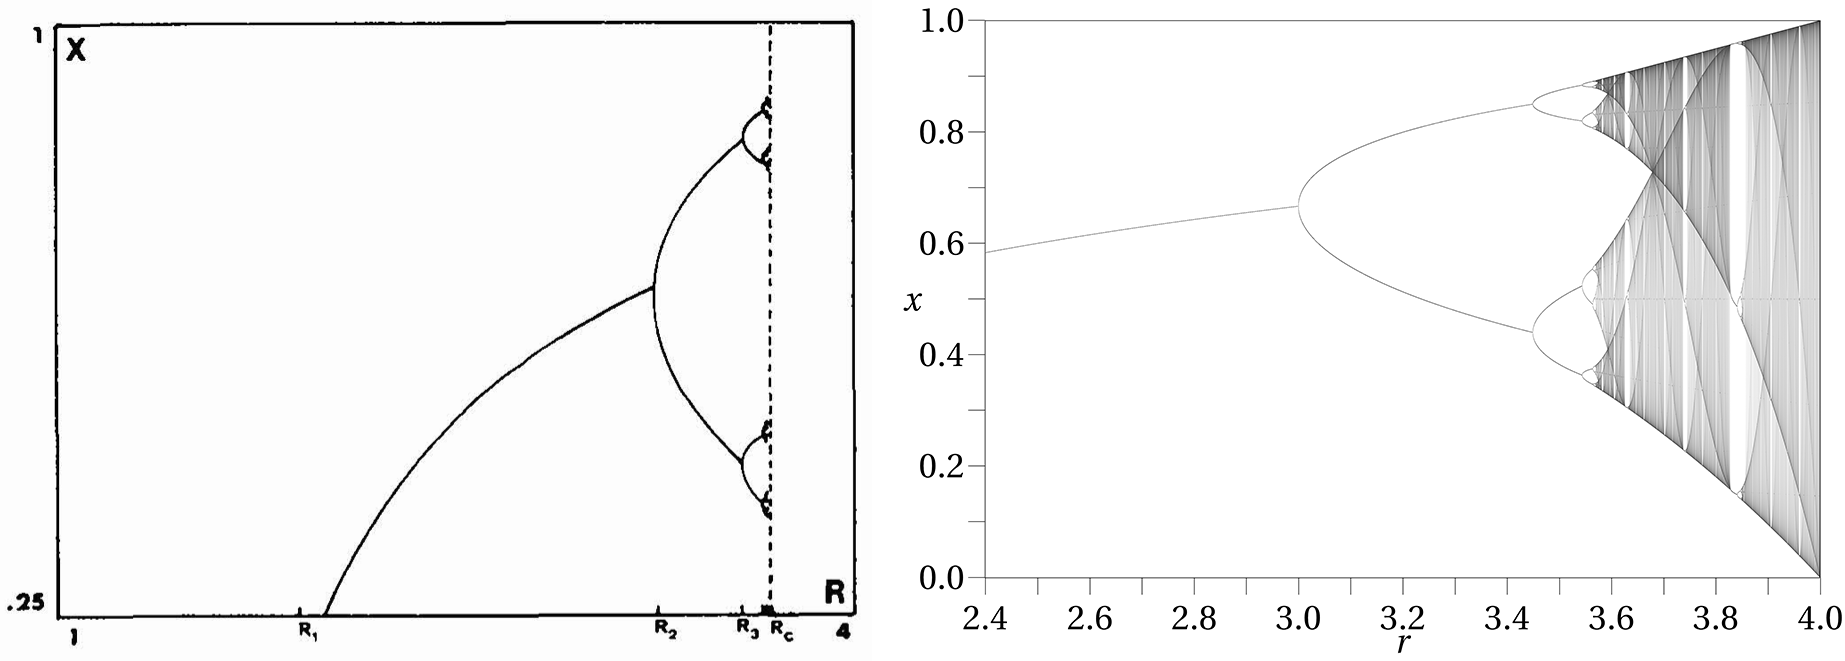
What they observed [2] [3] was a transition to chaos arising by a period-doubling bifurcation or “cascade”, but this was not new. The striking feature of these cascades was their “universality” : in the space of all (regular) one parameter families of dynamical systems (of fixed dimension) there is an open set such that any one parameter family inside this set will present the qualitative and quantitative universal properties of the accumulation of period doubling. Concretely, they studied different unimodal maps, and observed in particular that the limiting ratio of each bifurcation interval to the next between every period doubling is a universal constant named the Feigenbaum-Coullet-Tresser constant. Both Coullet-Tresser and Feigenbaum used renormalization group techniques to explain their observations. Both articles cite a famous paper by R. May [4] where he studies the logistic map as a “simple model with very complex dynamics” used for instance as the simplest nonlinear discrete-time model in population dynamics.
Using an HP-9825 and an XY plotter, Coullet and Tresser could visualize the iterates of the logistic map, change the parameter and see at once what was the resulting effect. They used HPL language (similar to BASIC) so they could change the value of a variable via the keyboard without stopping the program. On his side Feigenbaum used the HP-65 programmable calculator, the same as Michel Hénon.
Let us quote Oscar Lanford who proved Feigenbaum’s conjectures using computer-assisted proofs, see [5] :
“The methods used to study smooth transformations of intervals are by and large elementary and the theory could have been developed long ago if anyone had suspected that there was anything worth studying. In actual fact, the main phenomena were discovered through numerical experimentation and the theory has been developed to account for the observations. In this respect, computers have played a crucial role in its development.” [6] [7]
Is it possible to observe transition to chaos by a period-doubling cascade in a physics experiment or is it purely mathematical phenomenon ? The answer is positive. In 1979, Libchaber, Laroche and Fauve [8] observed this scenario in a beautiful convection experiment using liquid helium and later mercury. Tuning the temperature difference between the bottom and the top of the box containing the fluid, they observed the successive bifurcations with an amazing precision.
Digital interactive experiments :
Logistic map
source : https://experiences.mathemarium.fr/...
Bifurcation diagram of the logistic map
source : https://experiences.mathemarium.fr/...